

Work
From data to insight.
Every project on this page is labelled with what it is. Client work is only published with the client’s permission.
- Fig. 1
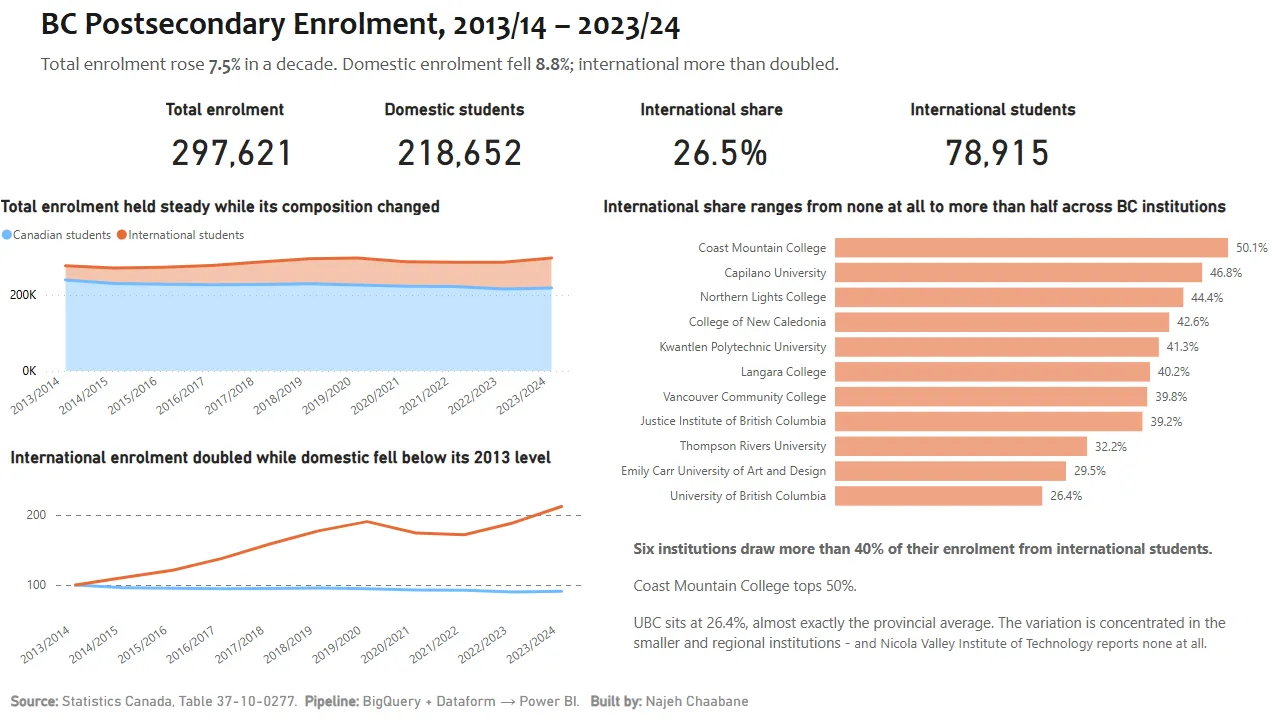
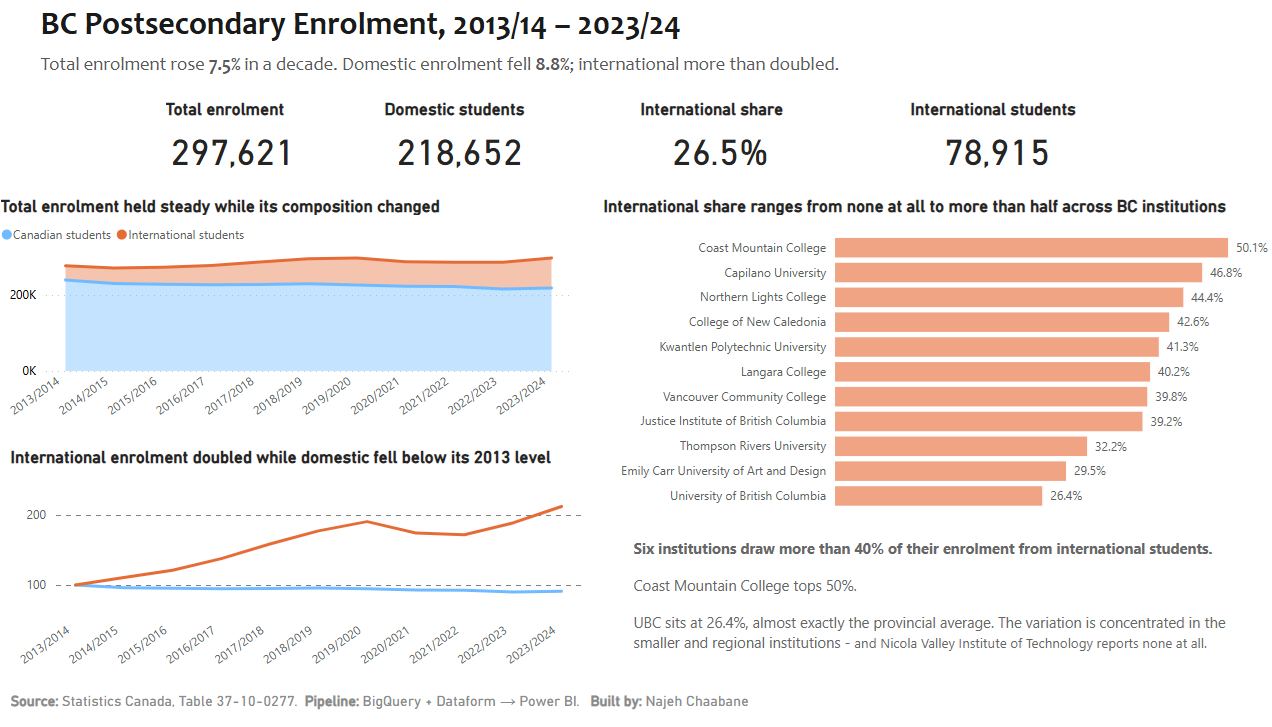
Any institution’s trend next to the BC benchmark
 View full size ↗ (opens in a new tab)
Source: Statistics Canada, Table 37-10-0277-01 Portfolio projectPublic dataBC post-secondary enrolment dashboard
Enrolment figures for BC institutions exist in Statistics Canada tables, but comparing one institution against the provincial picture takes hours of manual work. Using Table 37-10-0277-01 (2013/14–2023/24), I loaded the data into BigQuery, built Dataform pipelines with separate development and production environments, and modelled it in Power BI as a star schema with DAX measures for enrolment, growth, market share and student profile. The result is an interactive dashboard where any institution’s trend sits next to the BC benchmark.
Tools
- BigQuery
- Dataform
- Power BI
- DAX
- Fig. 2
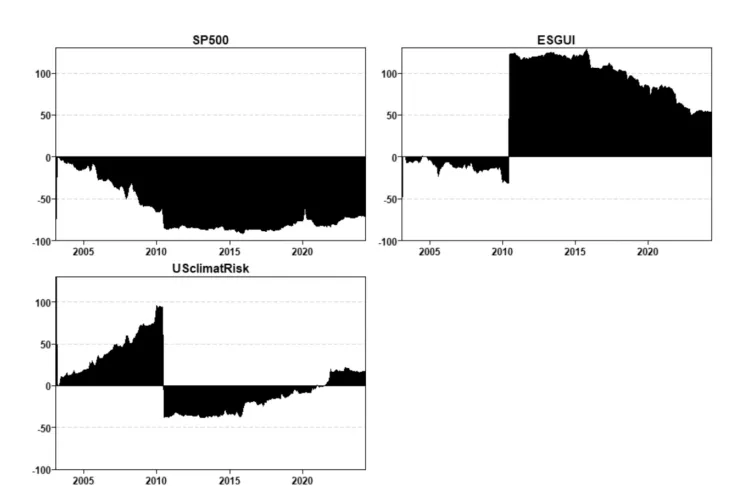
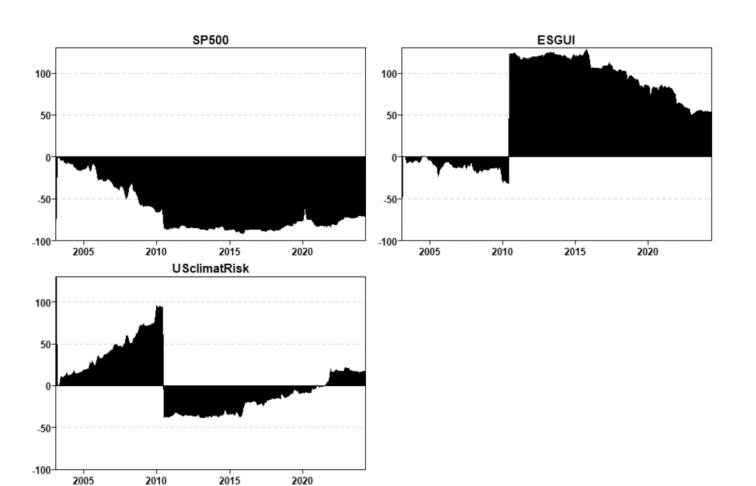
Net total directional connectedness over time
 View full size ↗ (opens in a new tab)
Source: Fig. B2, Appendix B (TVP-VAR, US context), Gaies, Chaabane, Adeosun & Sahut (2025), Energy Economics Dynamic Interactions between Climate Transition Risk, ESG Sentiment, and Stock Markets
How much do climate-transition risk and ESG sentiment move market value, and when? Using high-frequency European market data, I harmonized sources in SQL, ran time-series diagnostics, and applied TVP-VAR and quantile coherency models in R to trace how risk transmits between markets during periods of stress.
Tools
- SQL
- R
Citation
Gaies, B., Chaabane, N., Adeosun, O. A., & Sahut, J. M. (2025). Climate transition risks, ESG sentiment and market value: Insights from the European stock market. Energy Economics, 148, 108605. https://doi.org/10.1016/j.eneco.2025.108605
- Fig. 3
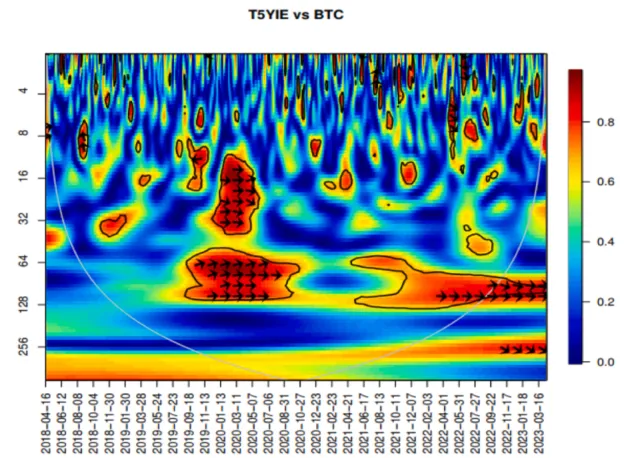
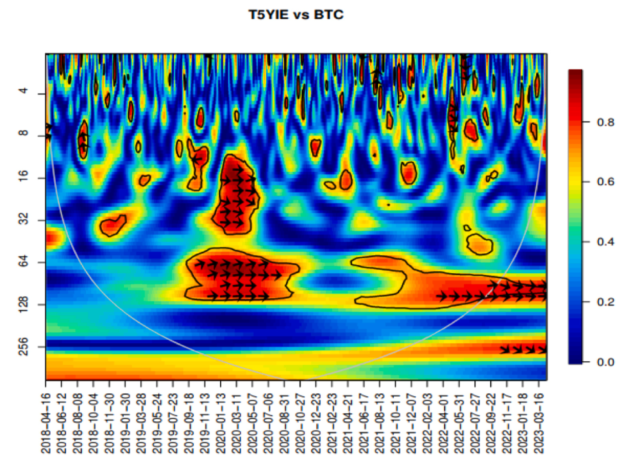
Wavelet coherence: Bitcoin and 5-year breakeven inflation (T5YIE)
 View full size ↗ (opens in a new tab)
Source: Gaies, Chaabane, Arfaoui & Sahut (2024), Research in International Business and Finance Crypto market stress testing: inflation and financial risk
Are Bitcoin and Ethereum a hedge against inflation, or just another risk asset? On a daily dataset built for 2018–2023 in Python, SQL and R, I ran statistical diagnostics (Jarque-Bera, BDS, Kruse, Hu & Chen) and applied wavelet coherence and quantile coherency to show how the dependence changes across calm and stressed regimes.
Tools
- Python
- SQL
- R
Citation
Gaies, B., Chaabane, N., Arfaoui, N., & Sahut, J. M. (2024). On the resilience of cryptocurrencies: A quantile-frequency analysis of Bitcoin and Ethereum reactions in times of inflation and financial instability. Research in International Business and Finance, 70(A), 102302. https://doi.org/10.1016/j.ribaf.2024.102302
What the labels mean
- Published research
- Peer-reviewed research; the badge links to the published paper.
- Client project
- Work for a named client, published with their permission.
- Anonymized project
- Real work for an organization that can’t be named.
- Portfolio project
- Self-directed work that shows a method or tool.
- Demonstration
- Built to illustrate a technique, using illustrative data.
Let’s make your data more useful.
Have a reporting, analytics or data challenge? Let’s discuss what you’re working with and what you need to accomplish.