Your numbers are scattered across QuickBooks, spreadsheets and grant reports. NashBridge brings them together into clear analysis, dashboards and reporting for small businesses, nonprofits and public-sector teams across British Columbia.
NashBridge combines quantitative expertise with modern analytics and business intelligence to bridge the gap between complex data and everyday decisions.
Rigour
Methods that hold up
Statistics and econometrics
Program evaluation
Survey and research analysis
Data quality assessment
Practice
Tools people use every day
Power BI dashboards and KPI reporting
Automated, scheduled reporting
Data transformation and pipelines
Spreadsheet automation
Languages
Work delivered in English or French.
Federal bilingual certification (PSC levels C/C/E, valid to 2031).
Tools
Python
R
SQL
BigQuery
Dataform
Power BI
DAX
Tableau
Excel / VBA
Stata
EViews
SPSS
SAS
Google Cloud
Approach
Start with the problem, not the technology.
01
Understand
Your goals, your data and the decisions it needs to support.
02
Assess
Data quality, reporting gaps and analytical challenges.
03
Analyze
Appropriate quantitative and analytical methods.
04
Visualize
Important information in a form people can understand.
05
Improve
Automate or streamline repetitive processes where it helps.
06
Support
Help your team use the results with confidence.
Founder
Built on analytical expertise.
I’m Najeh Chaabane, an economist and quantitative analyst. I hold a PhD in Economics, validated by WES as Canadian-equivalent, and I have more than a decade of university teaching experience.
My background spans statistics, econometrics, research and data analytics.
After more than a decade of research and teaching, I kept seeing the same gap: the organizations that could benefit most from careful analysis — small businesses, nonprofits, local public bodies — were the least likely to have anyone doing it. NashBridge is my attempt to close that gap in Victoria, with the rigour of academic work and the practicality that a small team actually needs.
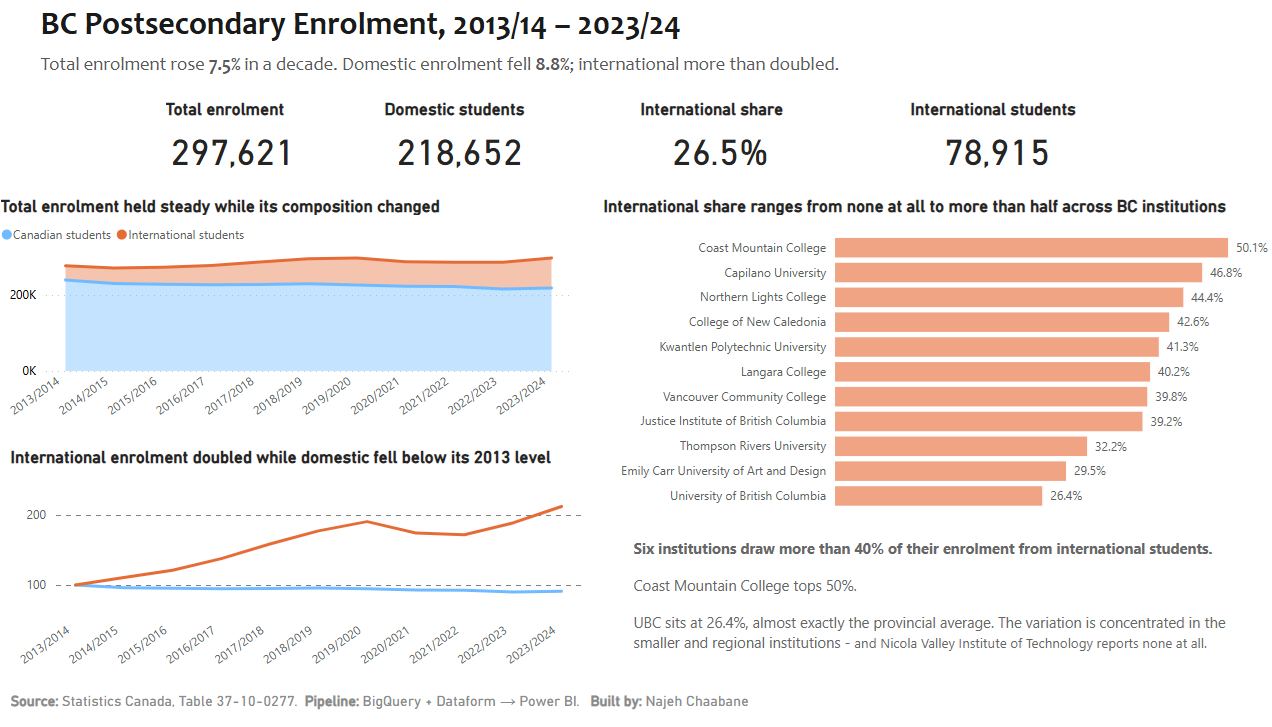
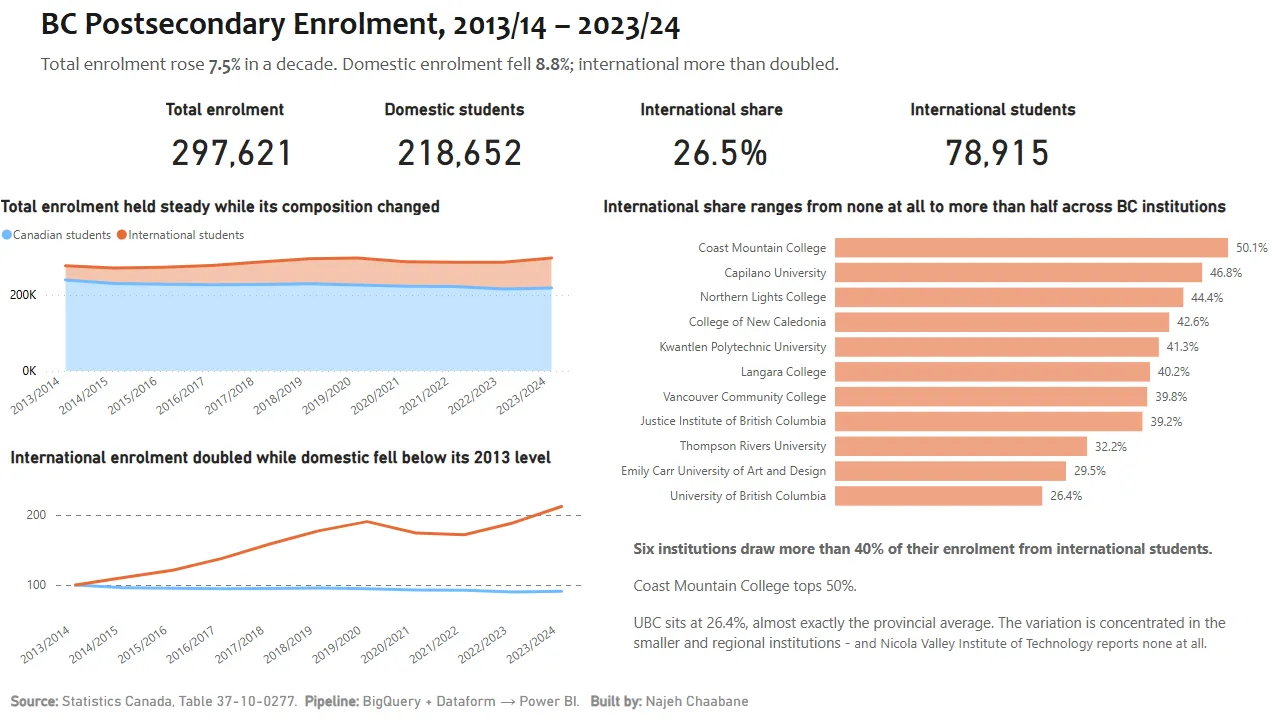
Enrolment figures for BC institutions exist in Statistics Canada tables, but comparing one institution against the provincial picture takes hours of manual work.



 View full size ↗ (opens in a new tab)
 View full size ↗ (opens in a new tab)
 View full size ↗ (opens in a new tab)